Reports
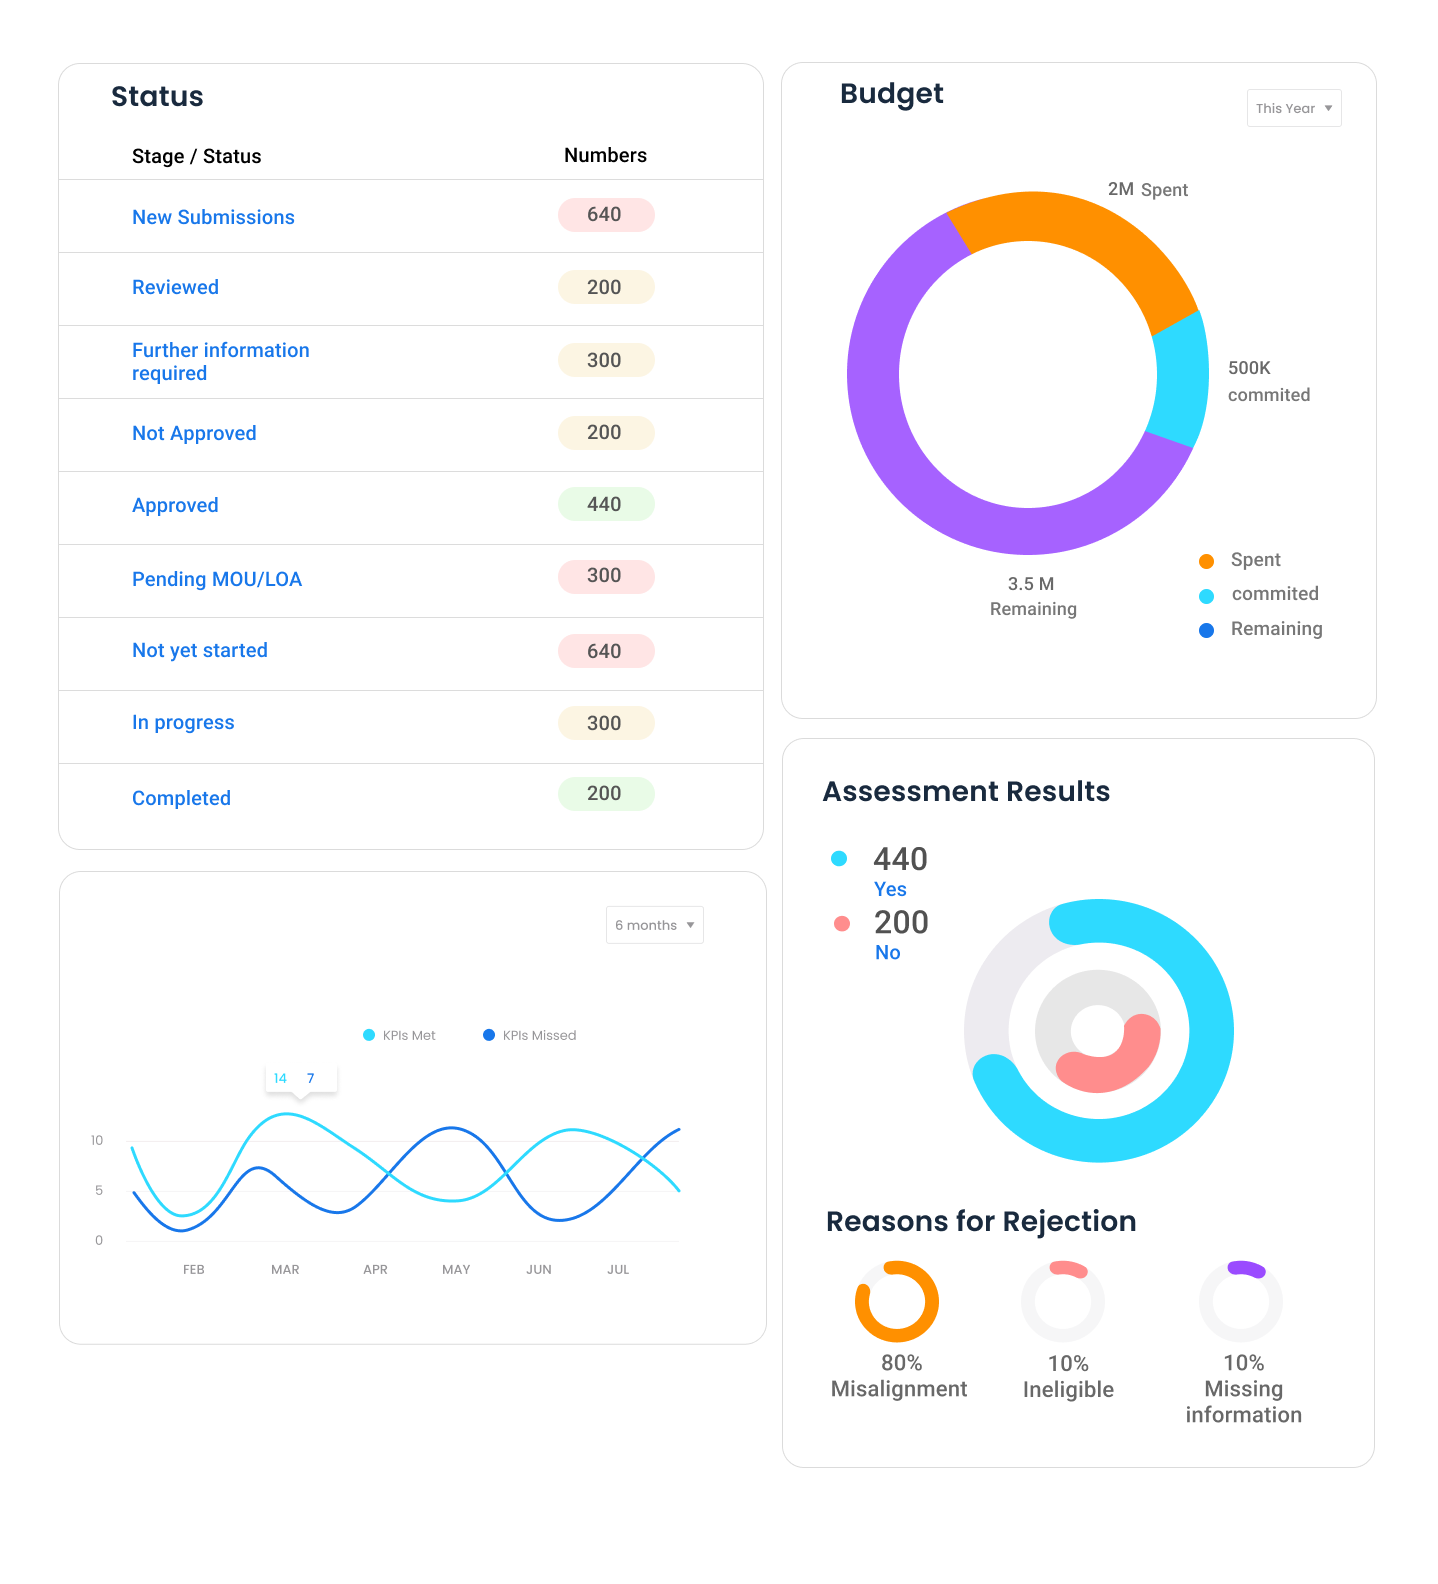
The Reports section provides an overview of Application Statuses or Stages, Budget Distribution, Assessment Results as well as Dynamic Reports. By default, this section displays reports for all grants. We can filter by a specific grant as well using the Filter grants.. dropdown at the top right.
Filtered Reports Page by Grant Name:
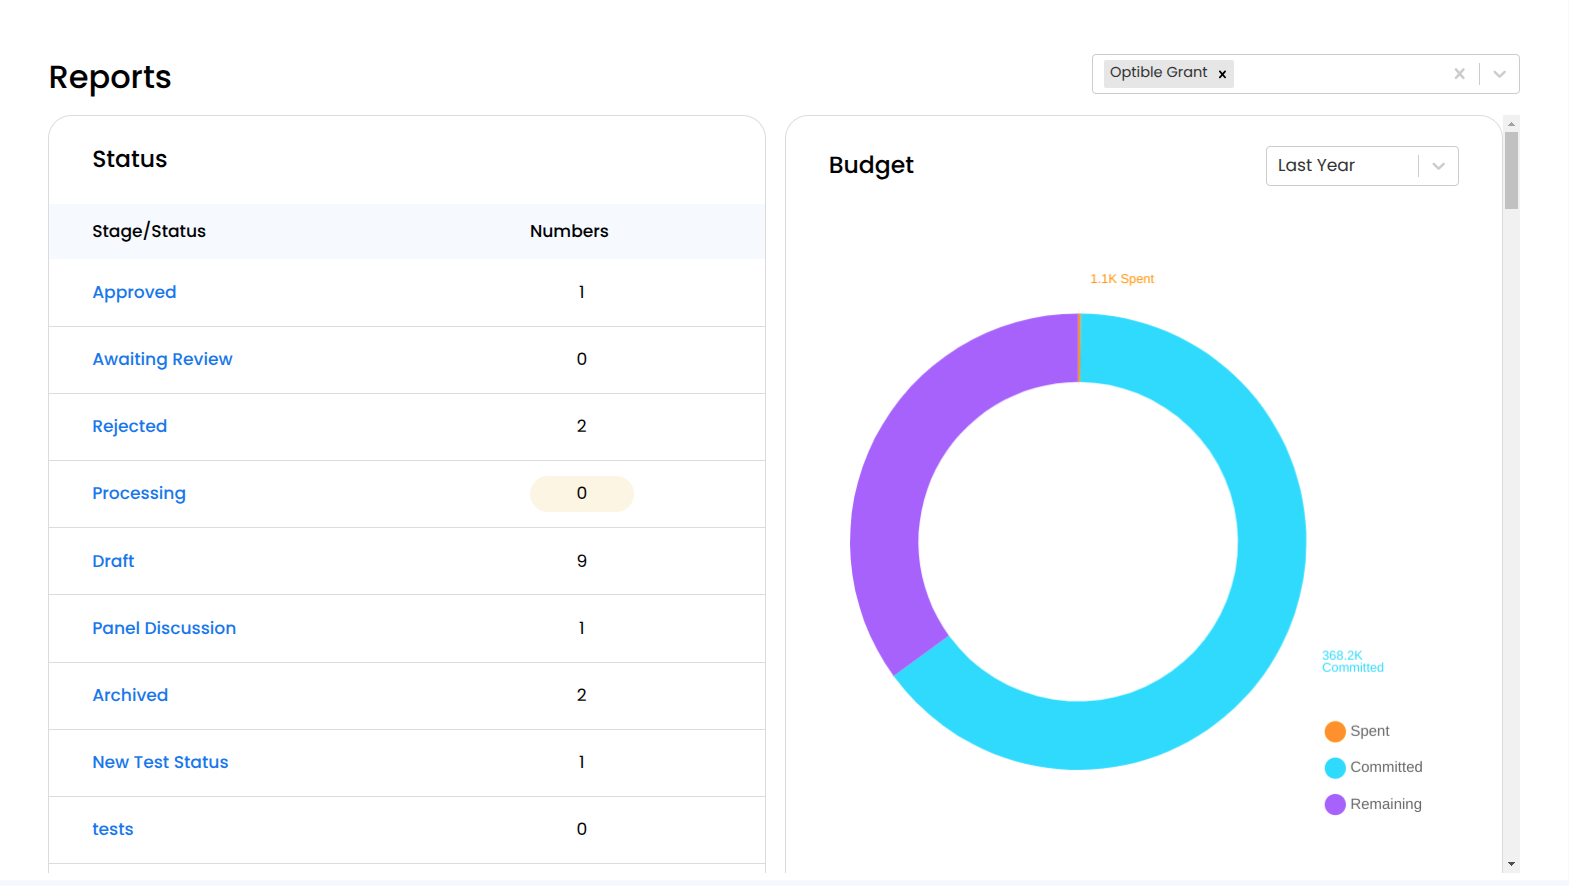
Status Panel
This Status table displays different stages of applications along with the corresponding count of applications in each stage.
Budget Panel
Provides a visual breakdown of grant spending in the form of a donut chart.
Categorizes financial data into three key segments: Spent, Committed, and Remaining.
Assessment Results Panel
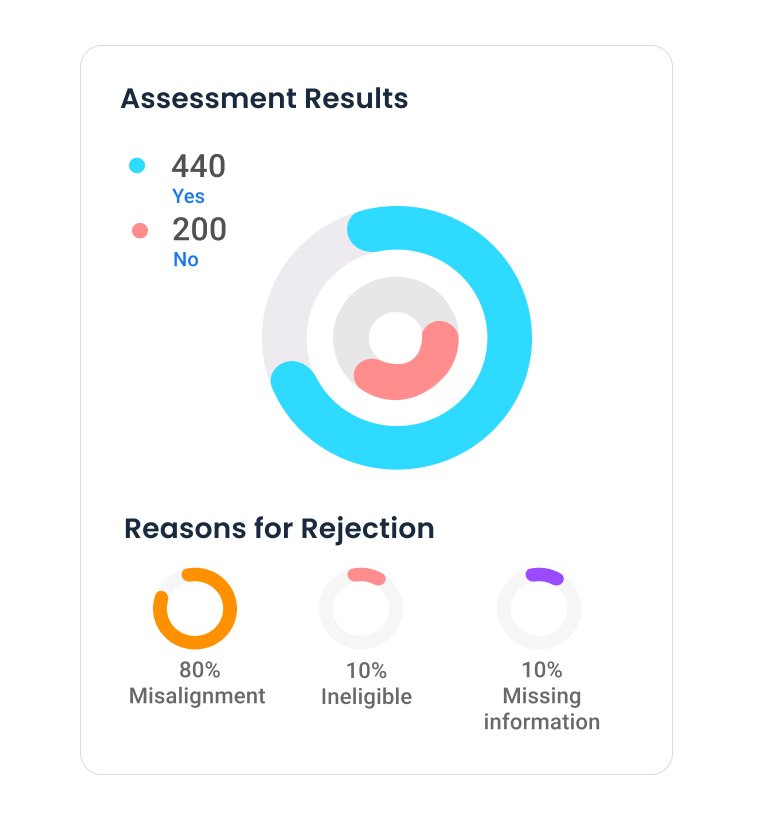
Presents a visual summary of assessment results including approval and rejection rates.
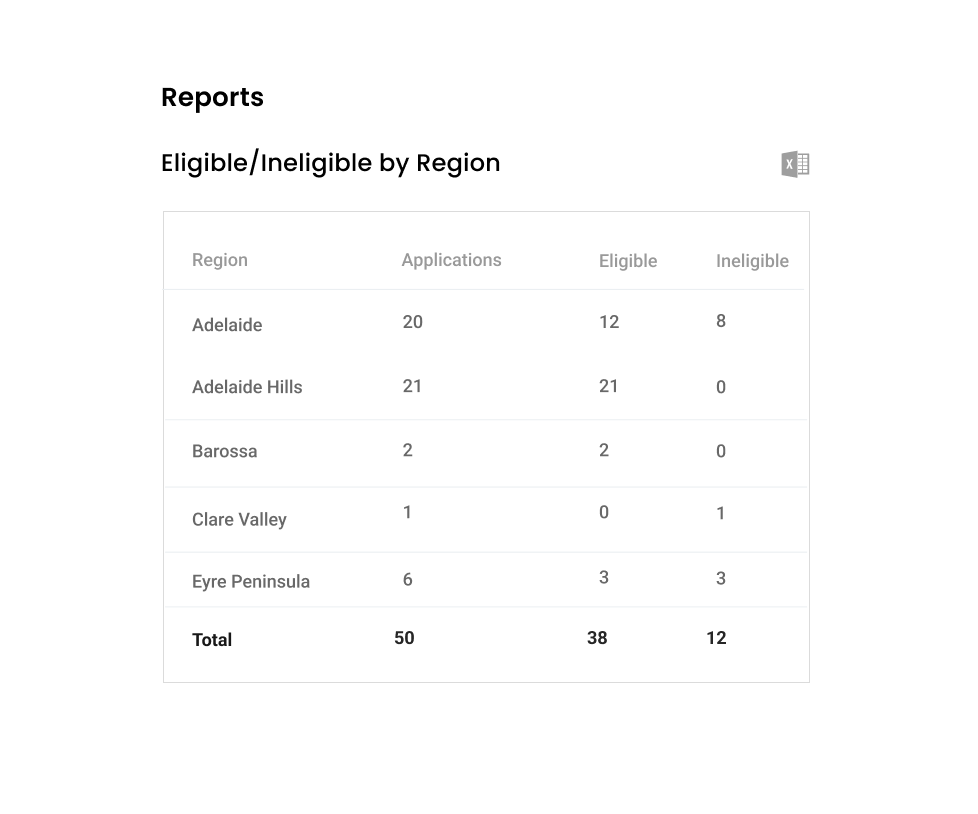
Dynamic Report
A customisable report allowing you to view data based on selected preferences. Reports can be exported as CSV.